The lag fix everyone copies works. Here's the price your speed test won't show.
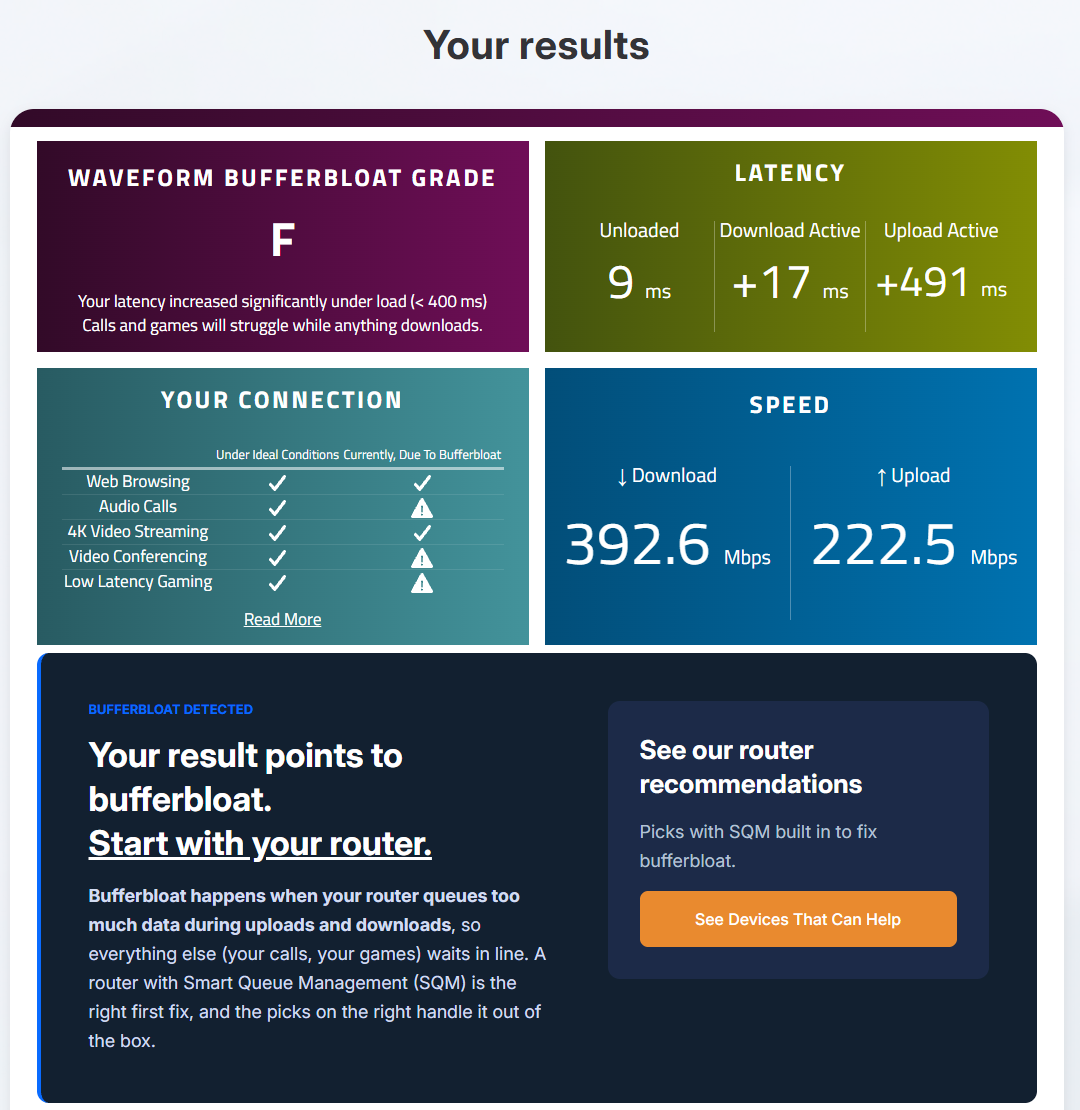
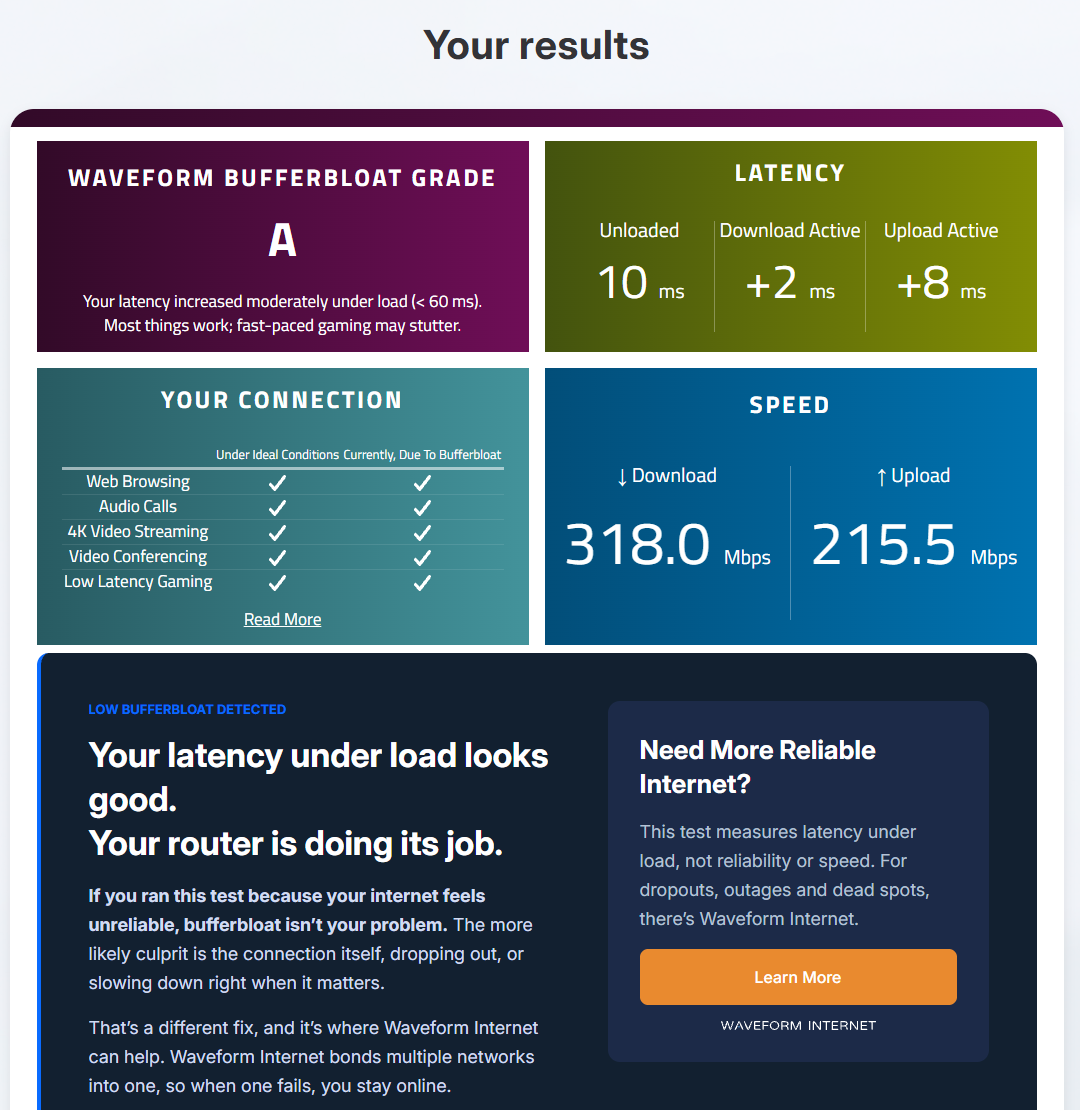
The fix comment sections keep recommending, turning off Windows' TCP receive-window auto-tuning, took my connection from an F to an A in every test I ran with it. An independent probe confirmed the lag spikes really shrank. The price: downloads that use a single connection got 13 to 21 times slower. So I switch it on to play and back off when I'm done.
Test it yourself
- Run Waveform's bufferbloat test three times with nothing else downloading. Write down the grade and the Upload Active number each time.
- Open an admin terminal: right-click Start, then Terminal (Admin).
- Turn auto-tuning off:
netsh int tcp set global autotuninglevel=disabled - Run the test three more times. If it didn't help, change it back (step 5) and stop.
- When you're done playing, turn it back on. While it's off, single-connection downloads can be 13–21× slower.
netsh int tcp set global autotuninglevel=normal - Not sure which mode you're in? Run this and check "Receive Window Auto-Tuning Level":
netsh int tcp show global
IPv6 isn't in these steps on purpose. Microsoft warns against turning it off; see the IPv6 card below before you try it.
The claims, one by one
A gigabit fiber line can still get an F
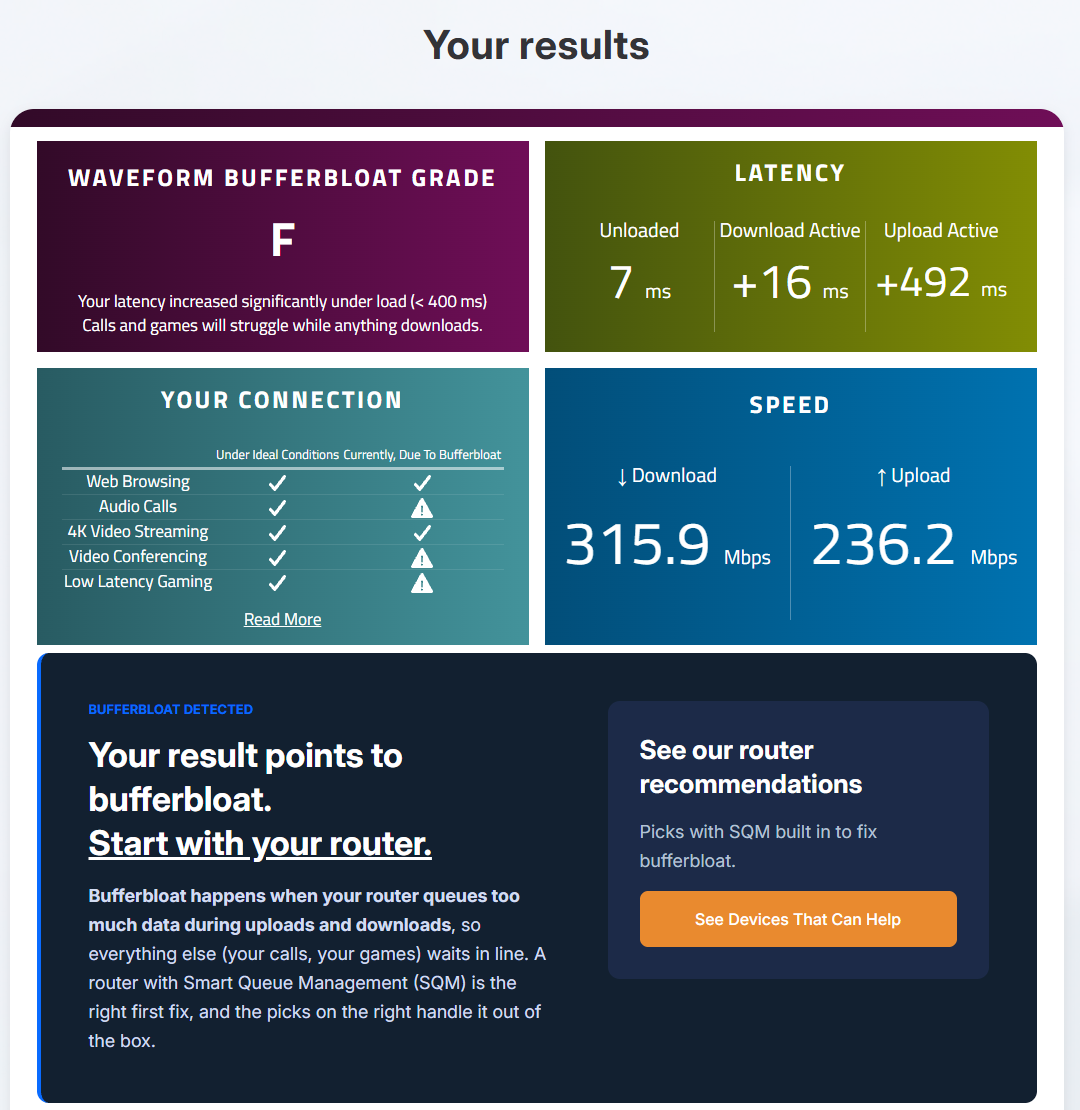
Before I changed anything, Waveform's free bufferbloat test gave my 1 Gig fiber connection an F. Sitting idle, it answered in 7 ms. While uploading, the delay went up by 492 ms, almost half a second. Waveform's own verdict: "Calls and games will struggle while anything downloads." The test measures how much extra delay piles up when the line is busy. It is not your ping to a game server.
Turning off Nagle's algorithm did nothing
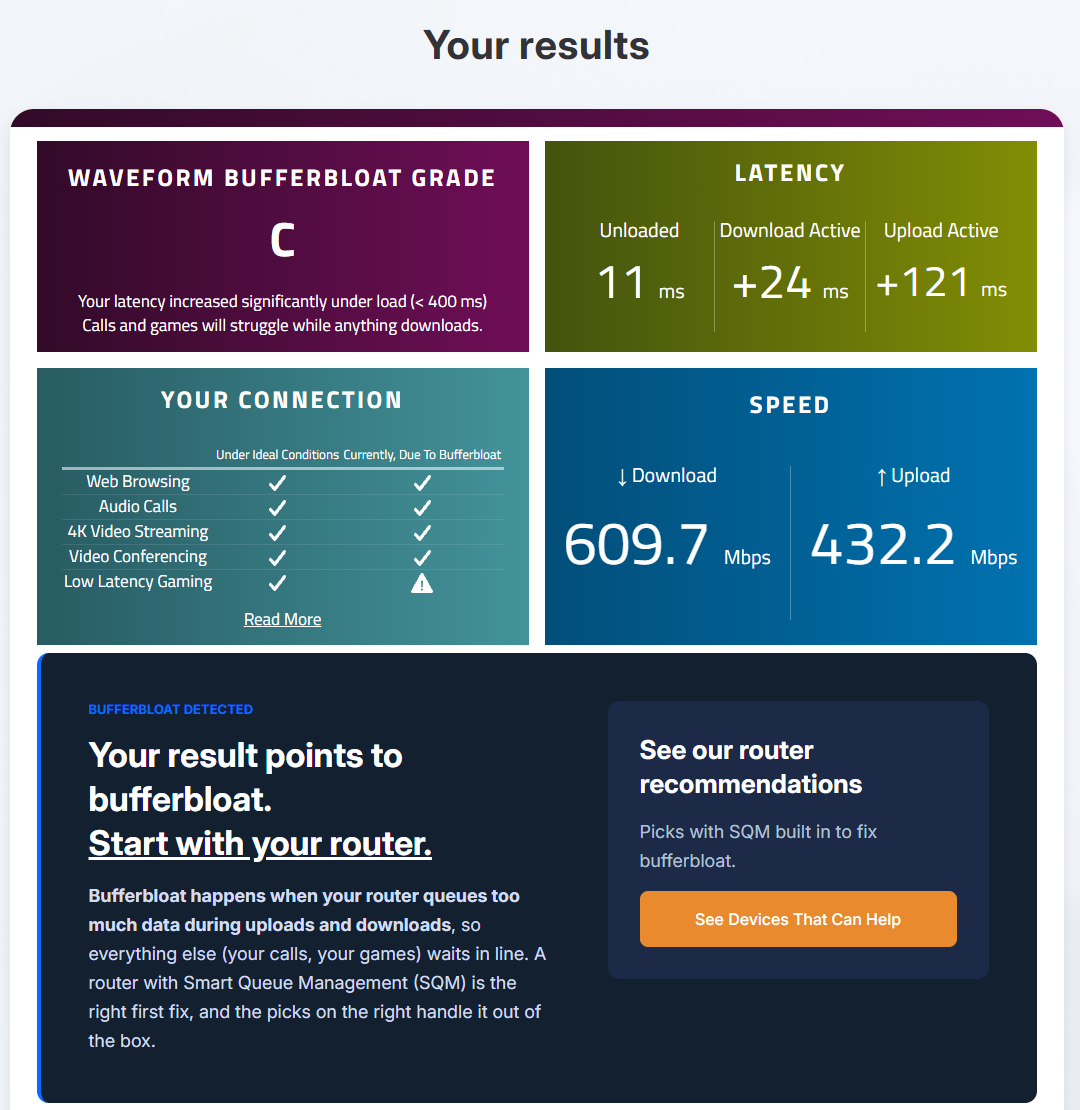
A one-click "optimize network" button took me from F to C (+492 to +121 ms). One test before and one after isn't proof, so I switched just Nagle's algorithm (and delayed ACKs) on and off for seven more runs, the last after a full reboot. All seven were C. Tweak on averaged +139 ms (Runs 1-3), tweak off +131 ms (Runs 4-6), and the reboot run was the best of all at +87 ms. The run-to-run noise was bigger than any on/off difference. The button changed other settings too, and those stayed on, so this rules out Nagle, not the whole button.
Network card power saving wasn't it either
Resetting my network settings to Windows defaults brought the F straight back (Runs 8 and 10: +503 and +917 ms) and roughly halved my upload speed, from about 436 to about 225 Mbps. That let me put things back one at a time. First suspect: the network card's power saving. I turned off the 4 visible settings, then all 14 values plus a reboot. Four more F's (Runs 11-14, +404 to +606 ms). Run 9 graded A but is invalid; see the run table.
Turning off IPv6 moved it from F to C/D, on my line
The reset had also switched IPv6 back on (it had been switched off on my network card before). I unchecked it again: next test a C, and upload speed back near 400 Mbps. Then I flipped it back and forth. IPv6 on: 9 of 9 F, upload +404 to +917 ms. IPv6 off: 5 of 5 C or D, +129 to +285 ms. The two ranges never overlap. During the flip runs (17-22) a traffic logger confirmed which protocol each test actually used. Microsoft warns against this: "We don't recommend that you disable IPv6 or IPv6 components or unbind IPv6 from interfaces. If you do, some Windows components might not function." It's a non-standard setup, so test it and undo it if it doesn't help.
Microsoft's recommended alternative didn't fix it, in Chrome
Microsoft recommends setting Windows to prefer IPv4 instead of switching IPv6 off. I set it and confirmed it took effect after a reboot. Still an F (Run 23, +448 ms). Waveform's test runs against speed.cloudflare.com, which has both IPv4 and IPv6 addresses, and Chrome's connection log showed it connecting over IPv6 (2606:4700:7::da) anyway. Chrome picks its own address and didn't follow the Windows setting. Only one run under this setting is valid (Run 24 stalled), so the log carries this one: it shows why it failed, not just that it did. That traffic log isn't in the downloads below; its readings are summarized here.
Disabling TCP auto-tuning: an A in 9 of 9 runs
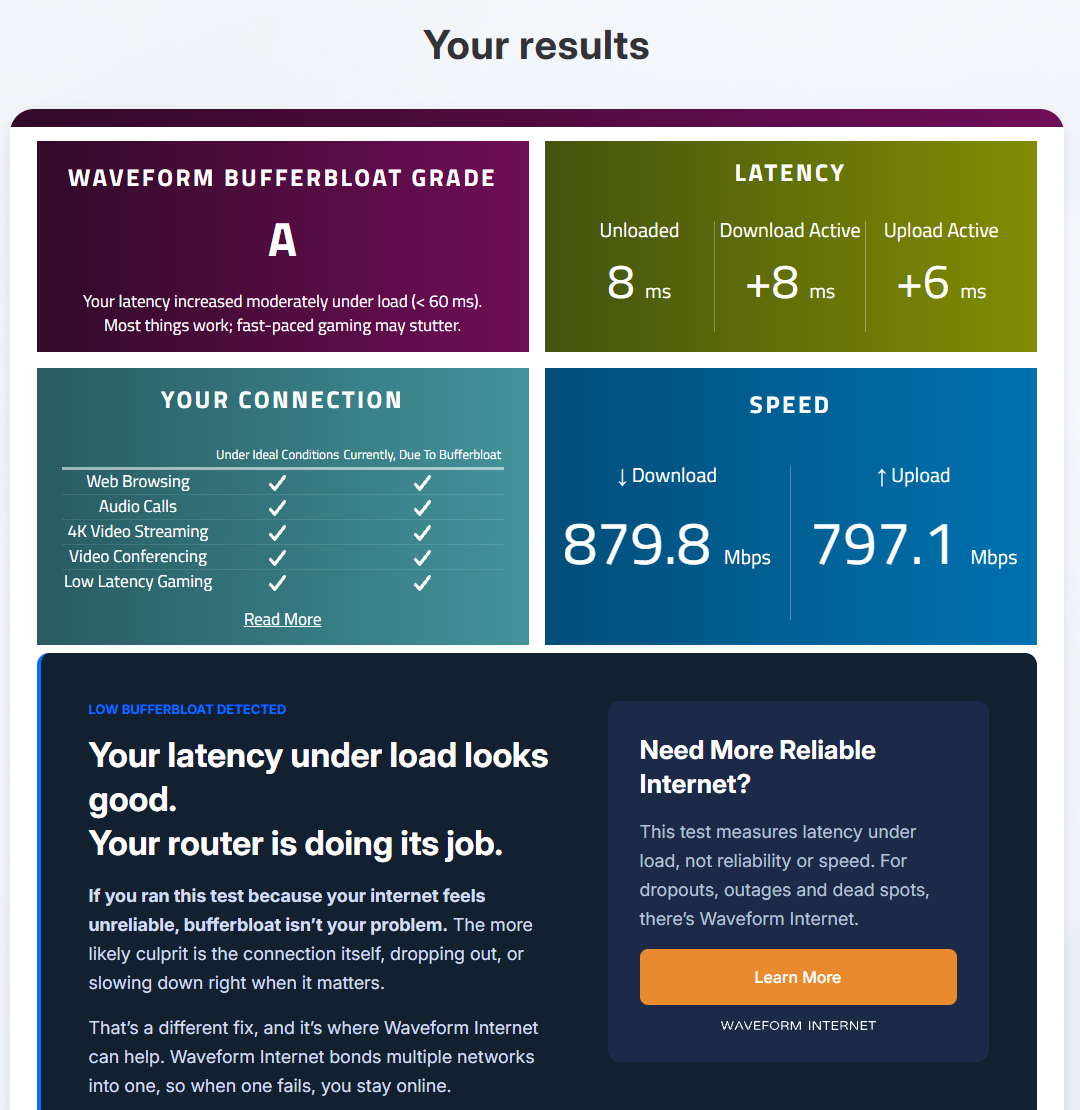
The fix that kept showing up in the comment sections, in 4 of the 8 I read: netsh int tcp set global autotuninglevel=disabled. I tested it the same way as everything else, alternating, three runs each. Normal: D, C, C (+83 to +201 ms). Disabled: A, A, A (+0 to +9 ms). In those runs Waveform's own download speed didn't drop (852 to 880 Mbps disabled vs. 712 to 791 normal). It swung more in later runs (381 to 836 Mbps disabled), and upload speed varied throughout. Counting every run I did with it disabled, IPv6 on or off: 9 of 9 A.
netsh int tcp set global autotuninglevel=disabled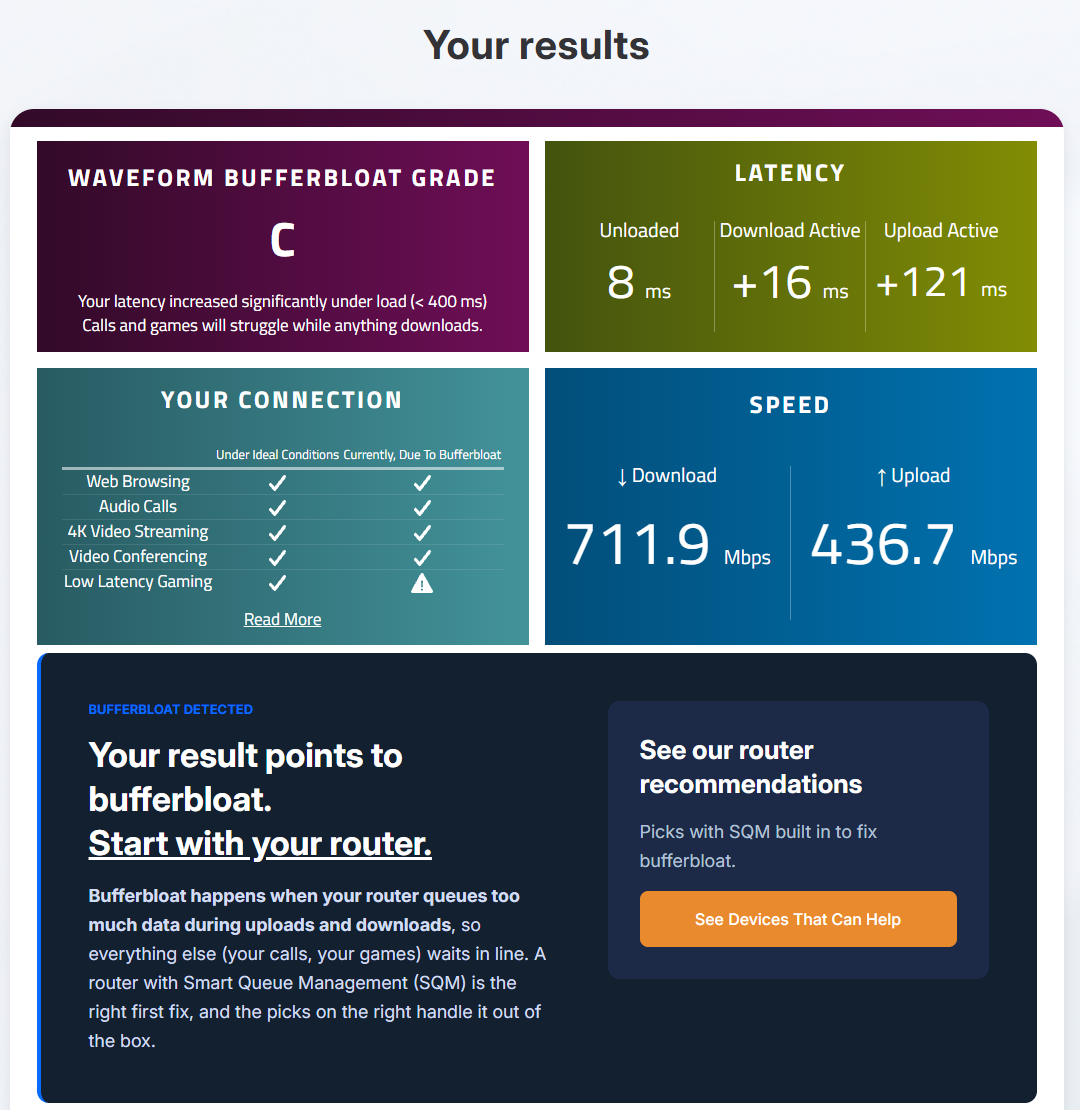
The "keeps your speed" version, highlyrestricted, did nothing
Some commenters say to use highlyrestricted instead, because it supposedly keeps your speed. Three runs, three C's (+111 to +126 ms), right inside the normal setting's range. No better than doing nothing.
It's not the test being fooled
Waveform grades itself, so I ran my own check during 12 of the runs. A small probe on my PC sent tiny UDP DNS queries and pings to Cloudflare (1.1.1.1, or its IPv6 address with IPv6 on) about 4.5 times a second and timed every one. It goes through the same router queue. During the upload phase with IPv6 off and auto-tuning normal, packets typically picked up +48 to +62 ms, about 1 in 4 (68 of 292) got more than +100, and the worst got stuck for +310 to +435. With it disabled, typically +6 to +11, and out of 408 packets the very worst was +31. With IPv6 on, the worst packets on normal waited +764 to +960 ms, almost a full second; disabled, the worst of 417 was +36. Even the worst packet with the fix beat the typical packet without it, on both IPv6 settings. The typical (median) delay fell by 42 to 51 ms with IPv6 off. That's just under the 50 ms bar I set before testing in 2 of 3 pairs, so on the median alone the honest verdict is "couldn't tell." The spikes, which are what you feel as lag, are the clean result. The table also gives each run's 95th percentile (the 1-in-20 bad packet). Limitation: Cloudflare isn't a game server.
| Run | Setting | Median | p95 | Worst | n |
|---|---|---|---|---|---|
| IPv6 off (Runs 34-39) | |||||
| Run 34 | normal | +62 | +238 | +310 | 89 |
| Run 35 | disabled | +11 | +15 | +21 | 131 |
| Run 36 | normal | +52 | +241 | +435 | 103 |
| Run 37 | disabled | +6 | +10 | +13 | 138 |
| Run 38 | normal | +48 | +220 | +340 | 100 |
| Run 39 | disabled | +6 | +11 | +31 | 139 |
| IPv6 on (Runs 40-45) | |||||
| Run 40 | normal | +243 | +811 | +830 | 46 |
| Run 41 | disabled | +19 | +30 | +36 | 155 |
| Run 42 | normal | +277 | +618 | +764 | 47 |
| Run 43 | disabled | +6 | +17 | +30 | 132 |
| Run 44 | normal | +375 | +673 | +960 | 42 |
| Run 45 | disabled | +15 | +22 | +28 | 130 |
Added delay in ms during the upload phase. p95 = the 1-in-20 bad packet. n = packets timed in that phase.
The price: single-connection downloads get 13 to 21 times slower
One of the videos I watched warns this command limits your bandwidth. I wanted to know which downloads, and by how much. So I downloaded a 100 MB file over a single connection with curl (20-second cap), auto-tuning normal and then disabled, alternating, from servers at three distances. Disabled caps every single-connection download, and the farther away the server, the lower the cap. Every pair repeated almost exactly. The full curl output wasn't saved; the speeds below are from the test log. A Cloudflare server was also tried and refused curl (HTTP 403), so it isn't counted.
Why your speed test doesn't show the price
During one Waveform run I logged Chrome's open connections every half second. The test held 6 to 7 connections at once to speed.cloudflare.com, 13 in total over about a minute. Spread across several connections to a nearby server, a per-connection cap barely shows. A lot of big downloads use just one connection, and that's where you pay.
Do you need both fixes? For lag, no
Every valid run since the network reset, sorted by the two settings (the Nagle-era runs and the prefer-IPv4 and highlyrestricted runs are left out). Auto-tuning disabled alone took an IPv6-on F to an A. IPv6 off still matters when auto-tuning is back on normal: that's the difference between an F and a C or D. What I run now: auto-tuning disabled before I play, normal after, through two desktop shortcuts. Credit to a commenter under another bufferbloat video who suggested exactly this toggle; I just measured whether it's worth it. I don't know why a setting for incoming data fixes upload lag. I tested that it does, and I'm not going to make up a reason.
| Auto-tuning normal | Auto-tuning disabled | |
|---|---|---|
| IPv6 on | F (12 of 12) | A (3 of 3) |
| IPv6 off | C or D (11 of 11) | A (6 of 6) |
Every run
Every graded test I ran, in order, including the invalid ones and the ones that disproved my first theory. Delays are added on top of the idle ping, in ms; speeds are Waveform's, in Mbps. Each result link opens the original Waveform result page. Blank cells weren't logged.
Sep 14: the first test, and the button that seemed to fix it
One test before and one after a one-click "optimize network" button. The button changed several network settings at once.
| Run | Time | What changed | IPv6 | Auto-tuning | Grade | Idle | +Down | +Up | Mbps ↓/↑ | Result |
|---|---|---|---|---|---|---|---|---|---|---|
| Sep 14 before | 11:56 | Before any change IPv6 state wasn't recorded on Sep 14. A snapshot taken before the Sep 24 network reset shows it switched off by then; when it was switched off can't be dated. | Not recorded | normal | F | 7 | +16 | +492 | 315.9 / 236.2 | Waveform |
| Sep 14 after | 12:13 | After the one-click button | Not recorded | normal | C | 11 | +24 | +121 | 609.7 / 432.2 | Waveform |
Sep 24, Runs 1-7: Nagle's algorithm on vs. off
Only Nagle's algorithm and delayed ACKs were switched. The button's other changes stayed on. Run 7 came after a full reboot.
| Run | Time | What changed | IPv6 | Auto-tuning | Grade | Idle | +Down | +Up | Mbps ↓/↑ | Result |
|---|---|---|---|---|---|---|---|---|---|---|
| Run 1 | Nagle off (tweak on) Runs 1-6 were logged without times; result links matched by order. | Off | normal | C | +17 | +156 | Waveform | |||
| Run 2 | Nagle off (tweak on) | Off | normal | C | +16 | +140 | Waveform | |||
| Run 3 | Nagle off (tweak on) | Off | normal | C | +22 | +121 | Waveform | |||
| Run 4 | Nagle on (tweak off) | Off | normal | C | +15 | +116 | Waveform | |||
| Run 5 | Nagle on (tweak off) | Off | normal | C | +18 | +123 | Waveform | |||
| Run 6 | Nagle on (tweak off) | Off | normal | C | +14 | +153 | Waveform | |||
| Run 7 | 13:51 | Nagle on (tweak off), after a full reboot | Off | normal | C | +15 | +87 | – / 436 | Waveform |
Sep 24, Runs 8-16: network reset, then one change at a time
A network reset put everything back to Windows defaults, which switched IPv6 back on. Network card power saving was restored first (Runs 11-14), then IPv6 was switched off (Runs 15-16).
| Run | Time | What changed | IPv6 | Auto-tuning | Grade | Idle | +Down | +Up | Mbps ↓/↑ | Result |
|---|---|---|---|---|---|---|---|---|---|---|
| Run 8 | 14:08 | After network reset (IPv6 back on) | On | normal | F | 10 | +18 | +503 | 580.5 / 223.5 | Waveform |
| Run 9 | 14:11 | Same as Run 8 Invalid. Upload only reached 53.6 Mbps, about a tenth of normal, so the upload never loaded the line and there was no queue to measure. The A is an artifact. | On | normal | A | 11 | +13 | +0 | 536.9 / 53.6 | Waveform |
| Run 10 | 14:18 | Same as Run 8 | On | normal | F | 10 | +17 | +917 | 338.8 / 229.1 | Waveform |
| Run 11 | 14:22 | Card power saving off (4 visible settings) | On | normal | F | 11 | +18 | +404 | 520.1 / 234.1 | Waveform |
| Run 12 | 14:24 | Card power saving off (4 visible settings) | On | normal | F | 9 | +35 | +448 | 516.1 / 254.1 | Waveform |
| Run 13 | 14:31 | All 14 power-saving values off, after a reboot | On | normal | F | 8 | +29 | +481 | 455.9 / 201.6 | Waveform |
| Run 14 | 14:34 | All 14 power-saving values off | On | normal | F | 10 | +15 | +606 | 423.3 / 248.1 | Waveform |
| Run 15 | 14:43 | IPv6 switched off Result link matched by time as "likely" (4 minutes before the logged time). | Off | normal | C | 9 | +15 | +152 | 453.1 / 394.6 | Waveform |
| Run 16 | 14:46 | IPv6 off | Off | normal | D | 10 | +14 | +210 | 429.9 / 424.4 | Waveform |
Sep 24, Runs 17-24: IPv6 flipped on and off, then Microsoft's alternative
IPv6 on (17-19), off (20-22), then IPv6 on with Windows set to prefer IPv4, Microsoft's recommended alternative (23-24). A traffic logger recorded which protocol carried each test.
| Run | Time | What changed | IPv6 | Auto-tuning | Grade | Idle | +Down | +Up | Mbps ↓/↑ | Result |
|---|---|---|---|---|---|---|---|---|---|---|
| Run 17 | 15:02 | IPv6 on Over 99% of test traffic was IPv6. The upload warm-up hung first and needed a page reload. | On | normal | F | 10 | +18 | +721 | 283.4 / 158.5 | Waveform |
| Run 18 | 15:07 | IPv6 on Over 99% IPv6. The upload warm-up hung once and needed a reload. | On | normal | F | 9 | +17 | +578 | 596.9 / 238 | Waveform |
| Run 19 | 15:09 | IPv6 on Over 99% IPv6. | On | normal | F | 9 | +37 | +477 | 490.2 / 263.6 | Waveform |
| Run 20 | 15:11 | IPv6 off 100% IPv4. | Off | normal | C | 9 | +5 | +129 | 298.1 / 459.6 | Waveform |
| Run 21 | 15:14 | IPv6 off 100% IPv4. | Off | normal | D | 9 | +15 | +285 | 730.3 / 446.4 | Waveform |
| Run 22 | 15:16 | IPv6 off 100% IPv4. | Off | normal | D | 9 | +16 | +219 | 748.1 / 452.5 | Waveform |
| Run 23 | 15:22 | IPv6 on, Windows set to prefer IPv4 The upload phase ran essentially 100% over IPv6 despite the prefer-IPv4 setting. | On, prefer IPv4 | normal | F | 9 | +22 | +448 | 523.6 / 246.8 | Waveform |
| Run 24 | 15:27 | IPv6 on, Windows set to prefer IPv4 Invalid. Upload stalled at 16.1 Mbps (the IPv6 warm-up hang), so the line was never loaded. Same failure as Run 9. | On, prefer IPv4 | normal | A | +0 | +0 | 526.3 / 16.1 | Waveform |
Sep 29, Runs 25-33: TCP auto-tuning, three settings, alternating
IPv6 off. Order fixed before testing: normal, disabled, highlyrestricted, three rounds. No stopping early, no added runs.
| Run | Time | What changed | IPv6 | Auto-tuning | Grade | Idle | +Down | +Up | Mbps ↓/↑ | Result |
|---|---|---|---|---|---|---|---|---|---|---|
| Run 25 | 11:53 | Auto-tuning normal | Off | normal | D | 10 | +16 | +201 | 791.2 / 445.3 | Waveform |
| Run 26 | 11:56 | Auto-tuning disabled | Off | disabled | A | 8 | +8 | +9 | 852.2 / 734.6 | Waveform |
| Run 27 | 11:58 | Auto-tuning highlyrestricted | Off | highlyrestricted | C | 8 | +17 | +124 | 838.8 / 475.7 | Waveform |
| Run 28 | 12:00 | Auto-tuning normal | Off | normal | C | 8 | +17 | +83 | 771.4 / 421.6 | Waveform |
| Run 29 | 12:04 | Auto-tuning disabled | Off | disabled | A | 9 | +9 | +0 | 875.8 / 363.7 | Waveform |
| Run 30 | 12:06 | Auto-tuning highlyrestricted | Off | highlyrestricted | C | 10 | +21 | +126 | 775.4 / 461.9 | Waveform |
| Run 31 | 12:08 | Auto-tuning normal | Off | normal | C | 8 | +16 | +121 | 711.9 / 436.7 | Waveform |
| Run 32 | 12:11 | Auto-tuning disabled | Off | disabled | A | 8 | +8 | +6 | 879.8 / 797.1 | Waveform |
| Run 33 | 12:13 | Auto-tuning highlyrestricted | Off | highlyrestricted | C | 8 | +16 | +111 | 817.9 / 447.6 | Waveform |
Sep 29, Runs 34-39: auto-tuning with an independent probe (IPv6 off)
Normal and disabled, alternating, while the probe timed small UDP and ping packets through the same router queue.
| Run | Time | What changed | IPv6 | Auto-tuning | Grade | Idle | +Down | +Up | Mbps ↓/↑ | Result |
|---|---|---|---|---|---|---|---|---|---|---|
| Run 34 | 12:22 | Auto-tuning normal | Off | normal | C | 9 | +17 | +124 | 662.3 / 420.8 | Waveform |
| Run 35 | 12:24 | Auto-tuning disabled | Off | disabled | A | 8 | +1 | +11 | 389.5 / 913.7 | Waveform |
| Run 36 | 12:27 | Auto-tuning normal | Off | normal | C | 8 | +16 | +149 | 706.9 / 466.9 | Waveform |
| Run 37 | 12:29 | Auto-tuning disabled | Off | disabled | A | 8 | +1 | +8 | 380.7 / 776.5 | Waveform |
| Run 38 | 12:32 | Auto-tuning normal | Off | normal | C | 8 | +27 | +122 | 575.6 / 451.5 | Waveform |
| Run 39 | 12:34 | Auto-tuning disabled | Off | disabled | A | 8 | +9 | +8 | 836.4 / 737.8 | Waveform |
Sep 29, Runs 40-45: auto-tuning with IPv6 on (stock Windows)
Same routine with IPv6 switched back on, the way most PCs ship. The probe ran over IPv6 and logged each run's protocol.
| Run | Time | What changed | IPv6 | Auto-tuning | Grade | Idle | +Down | +Up | Mbps ↓/↑ | Result |
|---|---|---|---|---|---|---|---|---|---|---|
| Run 40 | 13:12 | Auto-tuning normal | On | normal | F | 9 | +17 | +491 | 392.6 / 222.5 | Waveform |
| Run 41 | 13:14 | Auto-tuning disabled Waveform still flagged Low Latency Gaming at +21 ms despite the A. Run 45 cleared it at +16 ms. | On | disabled | A | 9 | +0 | +21 | 352.6 / 644.5 | Waveform |
| Run 42 | 13:16 | Auto-tuning normal | On | normal | F | 9 | +20 | +430 | 606.8 / 243.4 | Waveform |
| Run 43 | 13:18 | Auto-tuning disabled | On | disabled | A | 10 | +2 | +8 | 318 / 215.5 | Waveform |
| Run 44 | 13:27 | Auto-tuning normal A separate test from Run 42; the identical download speed is a coincidence (different result links). | On | normal | F | 9 | +19 | +496 | 606.8 / 247.1 | Waveform |
| Run 45 | 13:29 | Auto-tuning disabled | On | disabled | A | 9 | +10 | +16 | 688 / 600.6 | Waveform |
Results that aren't counted
They exist, so they're listed.
- Sep 24, 15:33: Unlogged test after Run 24 (no notes were kept, so it isn't counted). Waveform result
- Sep 24, 15:38: Unlogged test after Run 24 (no notes were kept, so it isn't counted). Waveform result
- Sep 29, 13:42: The connection-count run (used to count Chrome's connections, not graded). Waveform result
Probe run windows
Each run's time window in its probe file, so anyone can rerun analyze.py and get the same numbers.
| Run | File | Start | End |
|---|---|---|---|
| Run 34 | 2026-09-29-autotuning-probe-runs-34-39.csv | 12:19:30 | 12:22:32 |
| Run 35 | 2026-09-29-autotuning-probe-runs-34-39.csv | 12:22:46 | 12:24:25 |
| Run 36 | 2026-09-29-autotuning-probe-runs-34-39.csv | 12:24:46 | 12:27:36 |
| Run 37 | 2026-09-29-autotuning-probe-runs-34-39.csv | 12:27:48 | 12:29:19 |
| Run 38 | 2026-09-29-autotuning-probe-runs-34-39.csv | 12:29:35 | 12:32:34 |
| Run 39 | 2026-09-29-autotuning-probe-runs-34-39.csv | 12:32:46 | 12:34:58 |
| Run 40 | 2026-09-29-autotuning-ipv6-on-probe-runs-40-45.csv | 13:09:00 | 13:12:14 |
| Run 41 | 2026-09-29-autotuning-ipv6-on-probe-runs-40-45.csv | 13:12:29 | 13:14:40 |
| Run 42 | 2026-09-29-autotuning-ipv6-on-probe-runs-40-45.csv | 13:14:59 | 13:16:41 |
| Run 43 | 2026-09-29-autotuning-ipv6-on-probe-runs-40-45.csv | 13:16:53 | 13:19:30 |
| Run 44 | 2026-09-29-autotuning-ipv6-on-probe-runs-40-45.csv | 13:25:41 | 13:27:25 |
| Run 45 | 2026-09-29-autotuning-ipv6-on-probe-runs-40-45.csv | 13:27:40 | 13:29:51 |
Method
- Every graded test is Waveform's free bufferbloat test, run in Chrome on a wired PC with nothing else downloading.
- One change at a time. From Sep 24 on, each change was flipped back and forth so a single lucky or unlucky run couldn't decide anything.
- On Sep 29 the run order, the number of runs and the pass/fail rule were written down before the first test: no stopping early, no added runs.
- Invalid-run rule: an upload warm-up hang, upload under 100 Mbps, or probe gaps over 2 seconds. Invalid runs stay in the record, marked, and are left out of every count. Runs 9 and 24 never loaded the upload, so their A grades are artifacts.
- Auto-tuning was read as normal on Sep 29, and nothing in the test history changed it, so it's taken as normal for the Sep 14 and Sep 24 runs.
- The probe timed small UDP DNS queries and pings to Cloudflare about 4.5 times a second during Waveform's load and split each run into idle, download and upload phases by the network card's traffic. Added delay = each sample minus that run's idle median.
- Mistakes are left in on purpose: the Sep 14 F-to-C was a misleading single test, Nagle was the first theory and it fell apart, and the prediction written before the auto-tuning test (no change to upload delay) was wrong.
Setup
- Windows
- Windows 11 Home 25H2, build 26200.9457
- Browser
- Chrome 153.0.8010.54 (Sep 24 runs), 154.0.8037.58 (Sep 29 runs)
- Router
- Google Nest Wifi Pro (G6ZUC), software 3.78.518349, read Sep 28 and again Sep 29. It auto-updates, so the Sep 24 version can't be confirmed.
- Internet
- Google Fiber, 1 Gig plan
- Connection
- PC wired to the router, 1 Gbps link
- Sep 14 runs
- May have been on an earlier Windows build
What I didn't test
- A real game server. Waveform and the probe measure the delay your router's queue adds, which is what you feel as lag, but not your ping in any specific game.
- Other devices on the network. Both settings are per-PC; my phone, console and TV still wait in the same line at the router.
- A router with smart queue management (SQM). Waveform's own result page and most of the videos I watched point to it as the real fix for every device. I haven't tested one, so I'm not recommending one.
- Why it works. Auto-tuning sizes the receive window for incoming data, so a big effect on upload delay is surprising. I measured that it happens; I don't know why.
- Other ISPs, routers and PCs. These are my results on my setup. Run the test three times, change one thing, run it three more times, and change it back if it didn't help.
Raw data
The files every number on this page is built from. Check my work. Each file opens as plain text; save it from your browser to keep a copy.